
Welcome to this short, introductory tutorial for using x64dbg by Mr. Exodia. The goal of this tutorial is to teach you some of the fundamentals of the x64dbg and show you how closely its features and flexibility resembles its close cousin Ollydbg.While x64dbg is still in an alpha stage, its bugs are minor and few with only a crash happening under unlikely conditions.
1. The Configuration.
Configuring x64dbg is quite simple since the menu is much more concise than ollydbg, making the process much more user friendly. To access the configuration dialog, simply go to the Options menu and click Preferences. In the first tab labeled Events, you can configure what events you want x64_dbg to break on when they occur.

The configuration in the screenshot above is what I typically recommend and use for simple debugging. The options here are just like those found in ollydbg 1.10 with a few additional features. Here is the gist of what these features do.
System Breakpoint: When loading a new process, the will cause x64dbg to break in the system function which initializes the application you are attempting to debug.
TLS Callbacks: The TLS Callback is a function which is called before the main application runs. This can set parameters or even be used by certain protectors to implement anti-debug technology. This allows you to break on this function.
Entry Breakpoint: This causes x64dbg to break on the Entry point on the application. For general debugging, this is the only breakpoint you will need to have checked.
DLL Entry: This will break on the entry point of any DLL which is loaded by the process you are debugging.
Thread Entry: This will break on the first instruction of any new thread initialized by the current process.
Attach Breakpoint: When this is checked, it will cause x64dbg to break in the DbgUiRemoteBreakin function when attaching to an active process. If unchecked, it will attach without suspending the process.
DLL Load/DLL Unload: This will break in the system function when a new library(DLL) is loaded into or unloaded from the active process. The DLL Load breakpoint occurs before any of its code is executed.
Thread Start/Thread End: This allows us to break in system when our debugged application initializes or terminates a thread.

In the Engine pane, you will find a few advanced settings for the debugging engine. This should just be left as default in most cases, but here is a rundown of how they work.
Enable Debug Privilege: This allows you to attach to system processes.
Breakpoint Type: This feature allows you to try different types of breakpoints if your program detects or blocks the default INT3.
Undecorate Symbol Names: This makes symbol names look cleaner. It is an aesthetic feature.

In the Exceptions pane, you can tell x64_dbg which exceptions you would like to ignore and pass to the program. Leaving this blank will let x64_dbg break on every exception. If you want to ignore all exceptions, add the range 0-ffffffff using the Add Range button. The Add Last button will allow you to add the most recent exception which the program you are currently debugging incurred to the ignore list.

We can use the Disasm pane in order to change the appearance of the disassembled instructions. Here is a gist of what these options do.
Argument Spaces: This will put a space after every argument changing mov rax,rdx to mov rax, rdx. It essentially puts a space after every comma.
Memory Spaces: This puts a space in between memory reference instructions and their operators. This causes mov eax, byte ptr ds:[edx+18] to look like mov eax, byte ptr ds:[edx + 18].
Uppercase: This changes all of the text to uppercase.
Autocomments only on CIP: This will remove all comments, including references from the current disassembly except at the instruction pointer.

The Misc tab allows you to configure x64_dbg to be the Just in Time Debugger so that the system can attach it to a process whenever a problem occurs.
1. Debugging x64_dbg Sample:
In order to make this tutorial a little more hands on, I created a little program called x64_dbg Sample. It and its source are available for download directly from the x64_dbg sourceforge directory at the following link:
http://sourceforge.net/projects/x64dbg/files/extra/
Once you have downloaded this, extract it from the archive and let's open it in x64_dbg. To do so, you can start x64_dbg and drag and drop the file into the disassembly window or use the File -> Open option to do the same. Alternately, you can let the default x64_dbg program automatically register a shell extension for you so you can open files through the right click menu.
Once you have opened it and you had previously configured the event settings to Entry Point only, you should be at the entry point of the main module. In the interface, you will see that x64_dbg has many of the same shortcut keys as ollydbg.

In the debug menu, you can see that x64_dbg has the same hotkeys as Ollydbg. These commands provide some of the key operations that you will need to use in your regular debugging activities.
Run(F9): This starts or resumes the process normally.
Run(skip exceptions) (Shift+f9): This will resume the process while passing the current and all following exceptions to the process.
Pause(F12): This suspends the current process.
Restart(Ctrl+F2): This terminates the debugged process and reloads it.
Close(Alt+F4): This terminates and unloads the debugged process.
Step Into(F7): This allows us to enter a routine or execute the next step in a repeat instruction.
Step Into(skip exceptions)(Shift+F7): This allows us to enter a routine or execute the next step in a repeat instruction while passing the current exception to the application.
Step Over(F8): This allows you to execute an entire subroutine or repeat instruction without stepping through it instruction by instruction.
Step Over(skip exceptions)(Shift+F8): This allows you to execute an entire subroutine or repeat instruction without stepping through it instruction by instruction while passing the current exception to the application.
Execute Till Return(Ctrl+F9): This resumes the process until a return instruction is executed.
Execute Till Return(skip exceptions)(Ctrl+Shift+F9): This resumes the process until a return instruction is executed while passing the current exception to the application.
Breakpoints:
When you are debugging, one of the primary features you want to use is called breakpoints. There are 3 main types of breakpoints. We will briefly discuss these here.
Execution Breakpoint: This is the most common and most used type of breakpoint. When you toggle a breakpoint on a specific address, this tell the debugger to stop when that address is reached in the execution. To use this, simply press the F2 when over an address you would like to break on.
Memory Breakpoint: A memory breakpoint is used to pause an application when a specific area of memory is either accessed, written to, or executed. This is handy when you want to determine when or if a specific area of memory is used by the program. This is available in the right click menu of the memory map window and dump pane.
Hardware Breakpoint: A hardware breakpoint is used to pause an application when a particular address is either written to, read, or executed. This is specifically useful to determine when a particular variable is set. This can be used for byte, word, and dword reads and writes. This feature is available in the right click menu of the hex dump.
Let's Begin:
Now that we have a general understanding of the features in x64_dbg, we can begin debugging our first target. We already have our target loaded into x64_dbg, so let's Run it by pressing F9. As you can see, the application begins to run with the debugger attached to it. At this point, we can pause the application in x64_dbg and take a look at a few of its features. To pause the application, press F12.

When we pause, we arrive inside of a break-in thread created by x64_dbg. In order to get back to the main thread, we simply click the threads tab and double click on the one labeled main.

Once we arrive in the Main Thread, we can start stepping through the routines and analyzing the call stack. The Call Stack window gives you an extensive list of the functions and procedures(routines) which brought you to your current location. You can use this window to analyze these routines and learn about your application's execution routine. Just double click the one you would like to follow in the disassembler.

The Memory Map pane will show us all of the sections or regions of RAM allocated to and by our application and its dependencies.

Let's go ahead and resume the process by pressing F9. Let's attempt to enter the fake password '123456' into the application and see what message is returned when we click Check.

As we see, this is not a valid password because of the message 'Authentication Failed. Invalid Password!' Now that we know the message, let's use the built-in find referenced strings function in x64_dbg to see if we can locate this string inside of the application.To do this, we first need to verify that we are currently inside of the application module. Once this is verified, we can either click on the 'A' button on the top pane of x64_dbg, or left click in the disassembly pane and go to Search for -> String references.

This will build up a listing of all of the strings referenced in the application's code. Once you build up a list, we can use the search pane to filter the list and find the location of this string. However, since this is small application, a simple scroll to the bottom will reveal the location of where our string is referenced, as well as some other interesting strings.
Double clicking any of these will take you to their location in the disassembly pane. You can also toggle a breakpoint on these references by simply pressing F2. Let's follow the 'Authentication Failed..' string and see where it takes us.

In the picture above, I have set a breakpoint at the beginning of the function which checks our password. I have also added some comments beside of a few of the calls so that we can understand this a little better. If we were to step through this using f8, which steps over the calls, we can see the process. Let's toggle the breakpoint at the beginning of this function using F2, enter the value of 123456 into the password box and click Check. We will immediately break on our breakpoint. As we step, you will notice that we will get the password we entered in the text field and then hash it with the built in algorithm.

As we can see, our password is being run through a digest or hashing algorithm and being compared to a precalculated value which is stored in the program as a string. To determine which hash algorithm type this program is using, we can use my software hashing utility to compare the results for the string '123456'. In the debug sample, the hash returned for '123456' is 'e10adc3949ba59abbe56e057f20f883e'. Let's see which algorithm produces the same.

It appears that our hash algorithm is MD5. Since the hash is compared to a hardcoded value, it may take a long time to bruteforce or recover the original password. Using x64_dbg, we have the ability to patch or modify the instructions so that it can accept any password as valid. In the code above, our hashes are compared. If they are equal to each other, the program tells us the password is valid. If not, we are told it is invalid. Using the built in assembler, we can change the location of where the comparison jump lands. That means if we change it to the next instruction, it will always show that the password is valid regardless of what we enter. To use the assembler, we simply press the space bar when we are over top of the instruction we want to change.
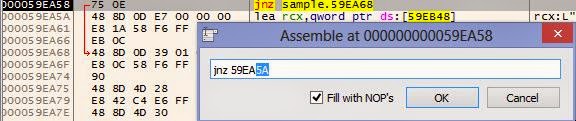
Normally, this would jump to VA 59EA68 if the password is invalid. Here, we will simply change the address to 59EA5A so that it will always go to the valid password code regardless of what we enter into the field. After we click OK, the instruction is immediately modified in memory. Now that we have patched, let's test the '123456' password again.

As you can see, anything we enter now will be the correct password. However, this patch only affects the memory of the process. Once we restart the program, this patch will be gone. If you want to make this patch permanent, you can save this to disk. This will make a modified copy of our executable that will always accept a fake password. To do so, we open the patch dialog by clicking the button with the bandage on it at the top.

Once this is opened, we can check the patch you want to save, and this click Patch file. This will allow you to save the modified program directly on disk under any name that you specify.
Now, since we know how the algorithm works, let's see if we can break the password. Online there are multiple databases that will check if they have a solution to your hash. In order to copy the built in hash as a string, we need to follow the value in the dump.To do so, right click on the instruction which points to the built in hash and go to Follow in Dump -> Address.

Now that we are in the dump, we need to highlight the hex values of the hash string, right click, and the click edit.

This will allow us to simply copy the string directly to our clipboard. Now that we have the hash, we can paste it into a hash solver such as the one available at hashkiller.co.uk.
Amazingly, it has found a solution saying that the password is ba321c. Let's open the unmodified program or restart the one in our debugger and try this value in the password field.

Using our minds and taking this simple approach, we have found the password.
This concludes this introductory tutorial for x64_dbg. This is a very powerful reverse engineering tool that offers a wide range of features and flexibility to accomplish even the most difficult tasks. We are very fortunate that the author has made this free and open source. We should always take the time to thank the developer who has worked hard on this with a small donation or contribution. I hope you found this tutorial helpful. If you have any questions, feel free to ask them below. Until next time, happy reversing.
Nyc :)
ReplyDeleteHi
ReplyDeleteIs there any way to contact you with PM here?
Ofcourse only if you're willing to help. I'm stuck and don't know anyone with skills and I just lost 4 nights on this and I wanna shoot myself, and my wife wants to kill me as well :) And I think it's easy for someone like you, and this kind of problem is always killing me with olly, when I'm searching for string in variable that is generated in code..I tried every approach I could find on internet tutorials, memory breakpoints, I just have no luck.
I don't want to write target name publically.
Anyway, thank you for your blog, I found it usefull cos I didn't know how to save changed file in x64dbg :)
This comment has been removed by the author.
ReplyDeleteHello Dock. If you know the memory location of the variable that the string is written to, you can use a hardware breakpoint on write -> byte to break after the instruction/operation that is writing the string to the variable.
ReplyDeleteHi Chester
ReplyDeleteNo, I don't know memory location. Last couple of days I have tried many breakpoints on locations where I assumed I would find it, and after no luck, I spent last night doing F7 from entry point to exit to main program (it's dll that I'm trying to figure out).
Basically dll recognises text from picture, and after it recognizes it, it puts X instead of last character it recognises. And I'm trying to find where it does that :)
I don't want to waste your time but If you're willing to help sometimes when you have half an hour for play with analisys, I would be grateful. I put my email to be visible. Anyway, thank you for your suggestion and help
Hi Chester
ReplyDeleteI solved it..yaay :)
I found good breakpoint where after pausing, I found string in memory and wasted 3 hours tracking where it's good, and where it's modified.
Every time I restarted debug session, memory address of string would be different.
Is there a function in Olly, "stop when program writes string 'xyz' anywhere in memory" ? :)
Just wanted to brag a little..I'm still learning
Best regards
dock
Very good work, my friend. Finding the address where a string is written to randomly allocated memory can be tricky when there is a lot of code. A few things that can possibly help with DLLs is to search for names in current module and search for any telltale names that can help you. Sometimes, you can find the function you are looking for just through a very obvious name. If this does not work, sometimes you just need to be patient and step through the subroutines until you see the values you are looking for. It is time consuming, but it is sometimes the only approach with complicated targets. You are progressing well. Never give up. Happy reversing. :)
ReplyDeletei need help
Deletei can pay for it , i have software i want to crack it
any one can help me
email : damar00200@gmail.com
facebook: www.fb.com/eng.mohaln
Awesome! :D
ReplyDeleteWith this boot, step by step. It was well explained.
A very good introduction to x64_dbg, thank you very much for your time Chester.
ReplyDeleteAfter easily follow, I've been wanting something more advanced with x64_dbg.
Best regards.
i need help
ReplyDeletei can pay for it , i have software i want to crack it
any one can help me
email : damar00200@gmail.com
facebook: www.fb.com/eng.mohaln
Wow cool briefing. Thanks a lot.
ReplyDeleteBut well could ya do some minor updated on the Setting/Misc dialog?
It now has two new fields 'Symbol Store' and 'Symbol Path'.
At the moment it's proper use is a little unclear to me. But would be awesome to make X64dbg automatically to get Debug symbols from M$ or my local cache with all those downloaded *.pdb.
Hi Chester,
ReplyDeleteGreat explanations. Clear, simple, straightforward.
I was wondering what further resources you would point to to go ahead with the learning process ?
I currently have the great old video course by lena101, it's great but kind of a little advanced (and for the old Olly mainly).
Do you know any reversing courses worth trying?
The Lena101 course is still great for building a foundation in reverse engineering, albeit a little dated. I still use the old ollydbg 1.10 over the new 2.0 in most cases since many of my favorite plugins were not ported. There aren't a lot of alternatives to this course that make the process easier. Before beginning, I do recommend that you have a mild understanding of programming and the ability to read assembly, however.
DeleteQuestion.. why is it i cant find the string that i want to search from a popup in the exe compiled from .net? when i search, it searches the ntdll.dll not the exe..
ReplyDeleteX64dbg is not designed for working with .net applications. One of the few instances when it may be useful is when there is native code embedded in the application. When I load a .net target, I immediately get an access violation exception in ntdll.dll. In order to do string searches in the main module, you need to go to the memory map panel and select the first section of the main module.
DeleteI actually have tried this and I still could not find the string refrence
DeleteThis comment has been removed by the author.
ReplyDeleteWait but how did you know the value of the hash? So you could find out which algorithm generates it. Sorry I'm a noob
ReplyDeleteFirst, you do not need to apologize for being a newbie. :)
ReplyDeleteI am not sure which hash you are talking about, so I will explain both. For the hash generated from the password we entered, when I first found the routine, I noticed that there is a hard-coded string that is 32 hex characters in length. When I saw this, my first thought is that it could be a hash. When you step through the routine after entering a random password, I realized that one of the routines took my password string as a parameter and returned a 32 hex character string like the one below. There a several types of hashes which have 32 characters, or 16 bytes when in binary form, such as md2, md4, md5, and maybe others. Md5 is the most common used amongst these. I verified which type it was by using a hashing tool such as mine or keygener assistant to compare the result to the value generated from the program. That is how I determined it was an MD5. For discovering the value of the hardcoded hash, I decided to try my luck with an online md5 database. It is impossible to reverse an md5 hash to get the original value, so either bruteforce or comparing it to the values in a massive online database is the only option. With luck, we were able to recover it.
thank you for such a speedy reply :) this stuff is definitely above my skill level i learnt a little bit of ARM assembly a few years ago. i've been trying to crack to program for a couple days now but can't seem to find a hash or generated password anywhere within the heap
DeleteIs there any way to just open a binary instead of running it? I try to analyze a plugin which cannot run on its own, so it literally cannot be debugged. I don't want to debug, I just want to look at the disassembly.
ReplyDeleteIf you want to view the plugin dll in x64dbg, it is complicated, but possible. The way I do it is to set x64dbg to break on System Breakpoint in the option menu. Then, I load the dll into x64dbg. Once we break at the system breakpoint, I will go back to the Option menu and enable the option to break on DLL Load. After that, I will keep pressing F9(run) until the the plugin dll is loaded. I can then access its various sections in the memory pane. If disassembly is all you want, you may want to consider using IDA pro to view it.
DeleteNot sure if you can help. I am trying to recover the password in multiple pre-built packet tracer modules so I can edit them.
ReplyDeleteIn case of we know the "Offset" value how can we locate to the exact address?
ReplyDeleteIf you right click in the disassembly pane, there is an option to go to a file offset:
Deletehttp://prntscr.com/efti9w
Simply enter the offset into the new window to go to its Virtual Address.
Thanks for your post, i have a bit of trouble about the breakpoin type. Can you please give me some material about it? I want to dig deeper into reversing
ReplyDeleteis it possible for x64dbg to output the disassembly view to a .asm file, if can is there a way to automate the whole process. need this to generate lots of asm file
ReplyDeleteUnfortunately, this feature is not supported by x64dbg. However, you can use the plugin Multiline Ultimate Assembler to rip disassembly.
Deletehttp://prntscr.com/ftk6cp
Ripped Code:
http://prntscr.com/ftk6um
Download:
http://rammichael.com/downloads/multiasm.rar
very nice work...
ReplyDeleteOk!
ReplyDeleteWhen I patch the file it do not come out as a .exe and just as a normal file and I cannot run it.
What am I doing wrong?
When prompted to save your patches, you need to make sure you add the appropriate extension to the file name before clicking save. Otherwise, it will save it as a generic file. You also cannot overwrite the original file when saving the patches in x64dbg. You'll have to save it under a new name such as: 'myfile2.exe'.
DeleteNice man, thx very much!
DeleteInvaild password...
ReplyDeletevery good tutorial!
ReplyDeleteSo what would you do if you can't find the string refrence in the main module?
ReplyDeletethanks
ReplyDeleteHi. This is a great article. I'm learning reverse engineering just for fun. I have managed to disable the odd watermark on some trial software but thats because they all had similar code. The one I have tried no matter what I do still has the watermark embedded. There is no string comment etc etc. How do watermarks get detected? Like I said I am doing this for fun justto wind down the winter nights that are coming. Cheers.
ReplyDelete